Notebooks and visualizations
The graphbrain.notebook package contains functions that are specifically meant for use with Jupyter notebooks. Currently it provides three hyperedge visualizations, meant to be used inside notebooks.
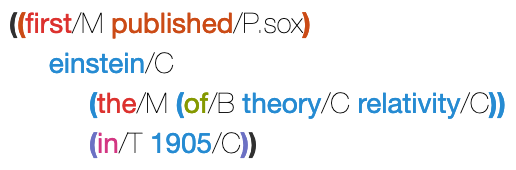
The function show() produces a indented visualization with syntax highlighting according to hyperedge type:
from graphbrain.notebook import *
show('((first/M published/P.sox) einstein/C (the/M (of/B theory/C relativity/C)) (in/T 1905/C))')
The optional argument style specifies layout style. The two possible options are “indented” (the default) and “line”.
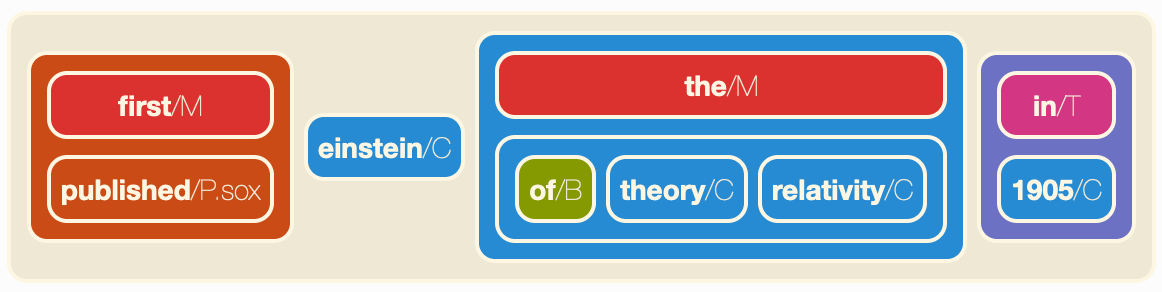
The function blocks() produces a block diagram, also using colors to distinguish hyperedge types:
blocks('((first/M published/P.sox) einstein/C (the/M (of/B theory/C relativity/C)) (in/T 1905/C))')
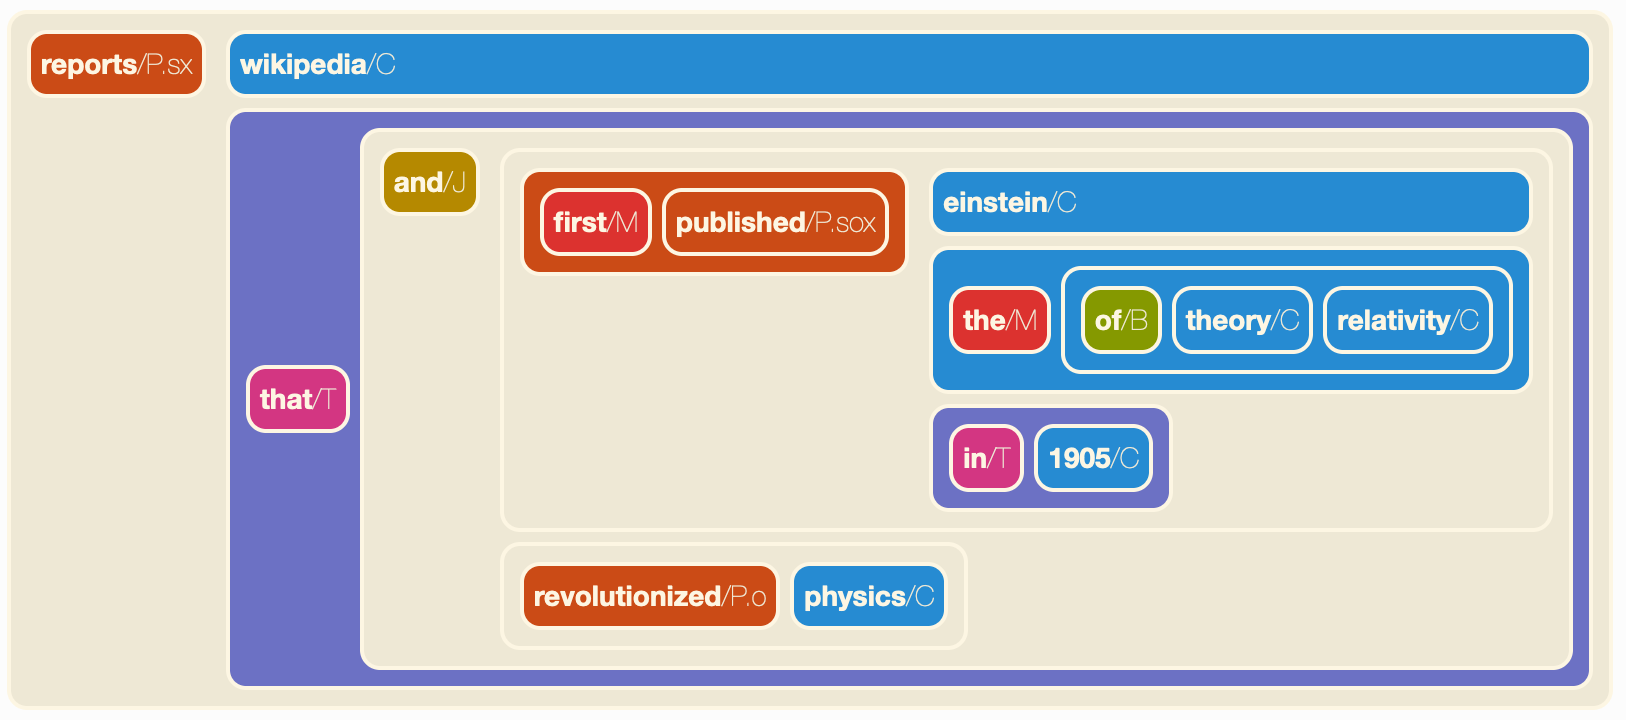
The function vblocks() also produces a block diagram similar to blocks(), which is more vertically spread and might thus be preferable for complex hyperedges:
from graphbrain import hedge
edge = hedge("""(reports/Pd.sx wikipedia/C (that/T
                 (and/J
                     ((first/M published/Pd.sox) einstein/Cp.s (the/M (of/B theory/C relativity/C)) (in/T 1905/C))
                     (revolutionized/P.o physics/C))))""")
vblocks(edge)
Both blocks() and vblocks() accept the optional arguments “subtypes” (default: False), “argroles” (default: True) and “namespaces” (default: False). These are meant to control the level of detail at which atoms are represented.